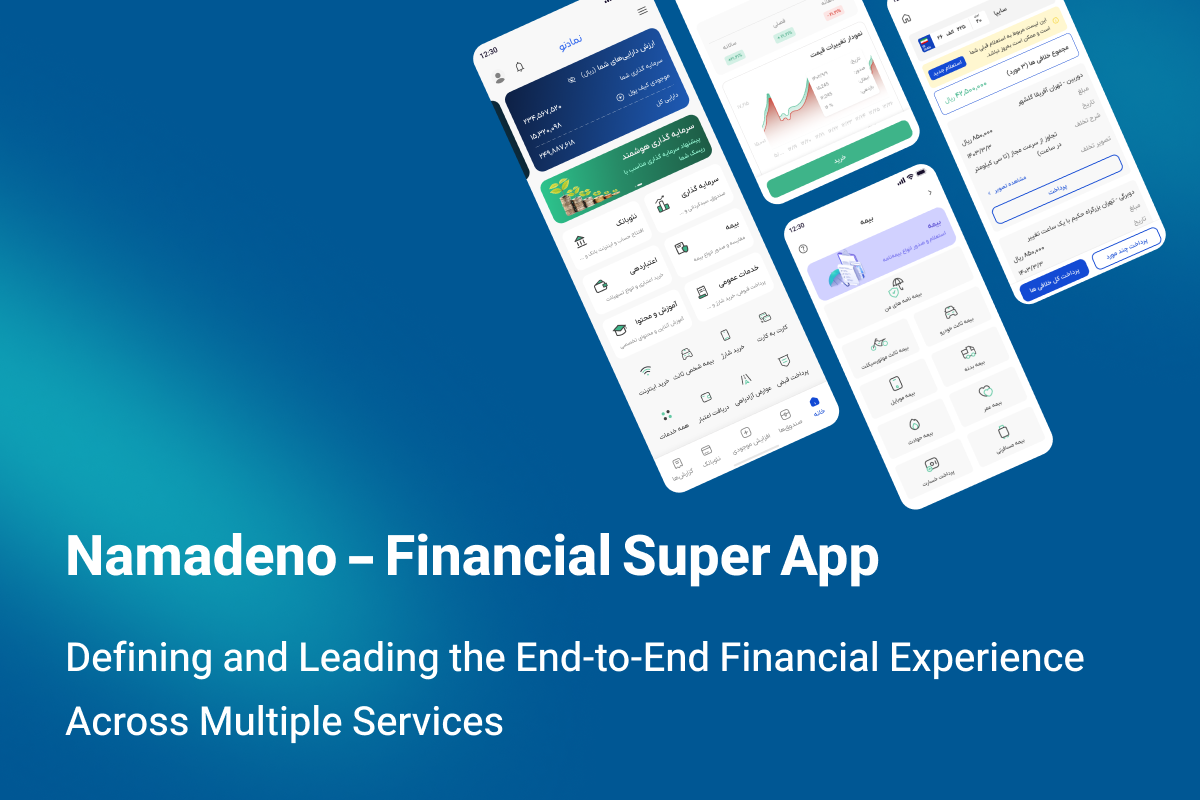
Designing a financial experience from scratch for multiple users and services
Product: Namadeno
Platform: Mobile (iOS / Android)
Role: Product Designer (Full Ownership)
Introduction/Challenge
When I joined the project, SuperApp was in a complicated state:
The previous external team had not delivered usable results.
Users were confused and had no clear flow between services.
There was no real data, no standard design, and no previous design patterns or systems.
The challenge was twofold:
User challenges: fragmented and confusing experience, lack of quick understanding of financial status and services
Team/Company Challenge: Lack of data and design, past ineffective project, need for independent decision-making
My responsibility:
To start from this mess and build a reliable and scalable MVP that provides a simple, clear, and reliable user experience.
Research and Discovery
At the beginning of the project, there was no user data, usage reports, or previous research available. So I started the Discovery phase with a focus on stakeholder alignment and extracting the team’s tacit knowledge.
Instead of stopping because of a lack of data, I defined an operational research path.
Actions taken:
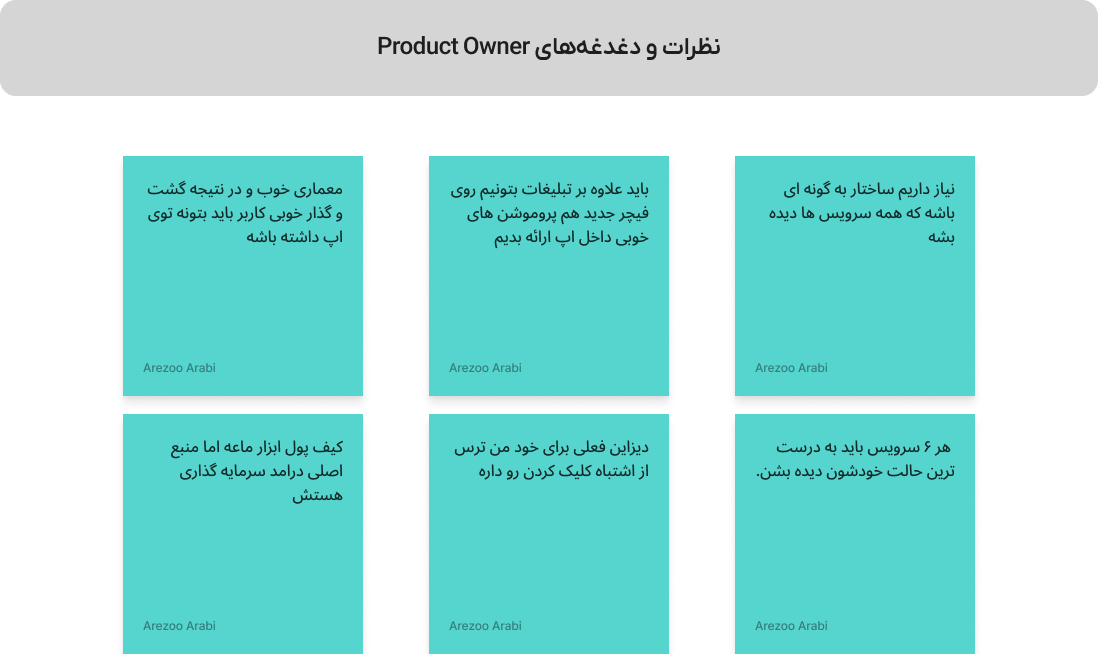
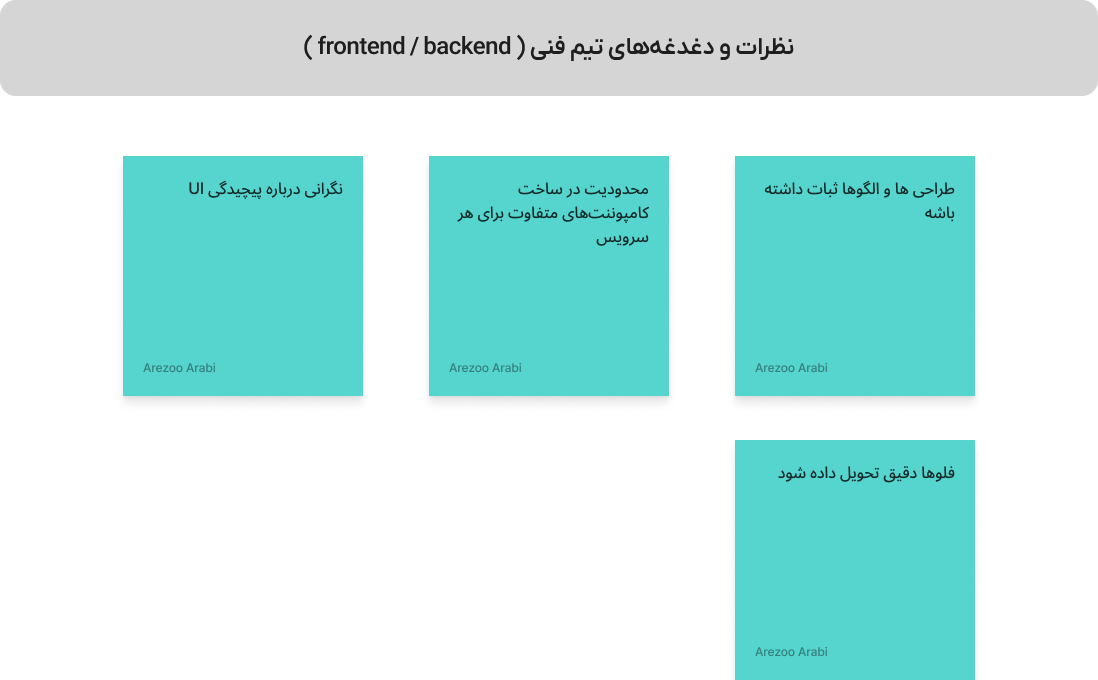
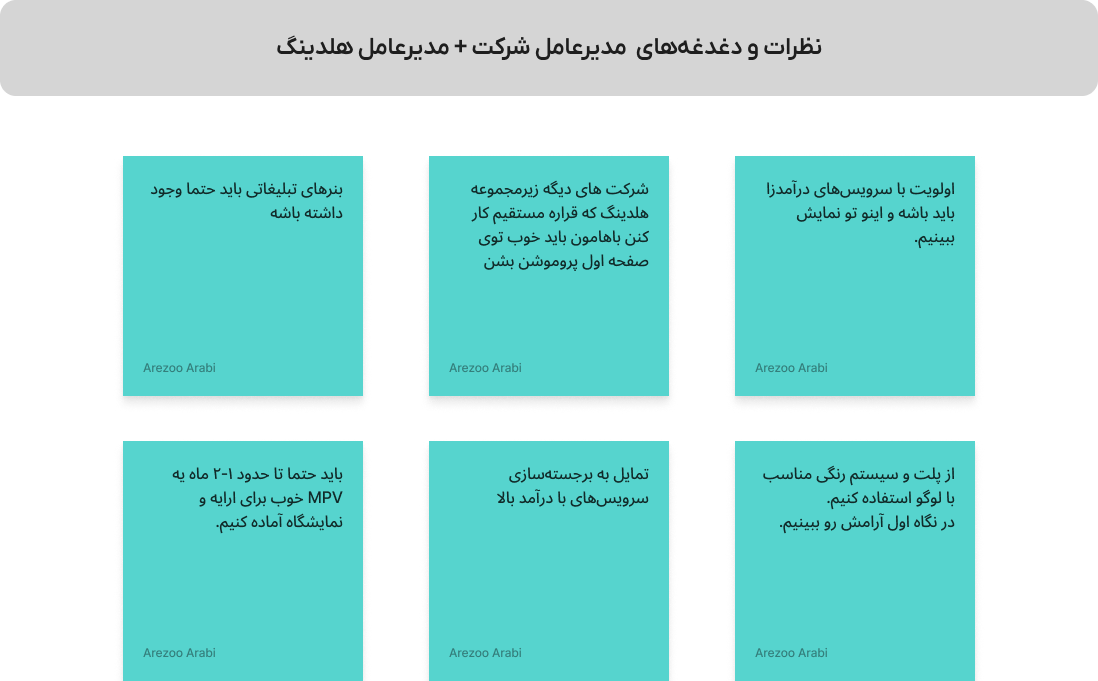
Structured interview with PM and holding stakeholders
Extracted business objectives for each service (investment, insurance, billing, charging)
Analyzed failed outputs of the previous team to identify points of failure
Reviewed internal and external financial and payment superapps
Analyzed common patterns in financial dashboards
Competitor Analysis and Patterns
Since real user data was not available, pattern analysis and competitor comparisons became the basis for decision-making. The analysis focused on:
How to integrate multiple services into a super app
Financial Dashboard patterns
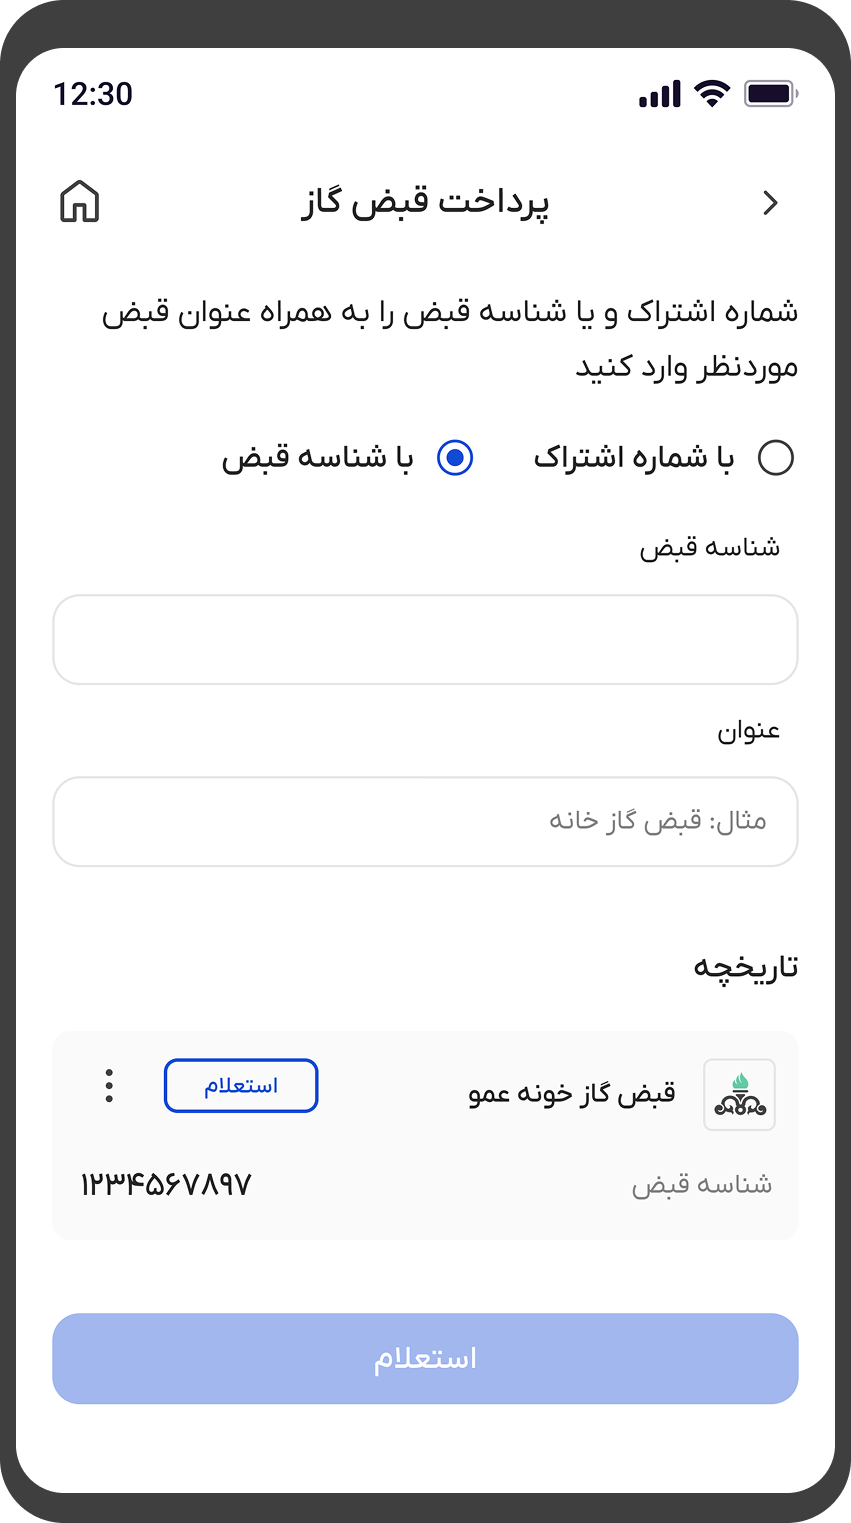
Bill and service payment flows
Navigation patterns in multi-service products
Goal: To extract sustainable patterns and avoid repeating the mistakes of fragmented experience.
Key Insights and Findings
The output of the Discovery phase revealed several recurring patterns:
Users experience navigational confusion in fast-paced multi-service products
Unstructured simultaneous display of services reduces trust
Financial dashboards should be “quickly interpretable,” not just “full of data”
Payment flows should have minimal decision and minimal friction
Consistency across services is more important than visual variety
In fact, it wasn’t just a matter of designing multiple financial services, it was a matter of designing a single mental model for using multiple services in one app.
Opportunities and Product Direction
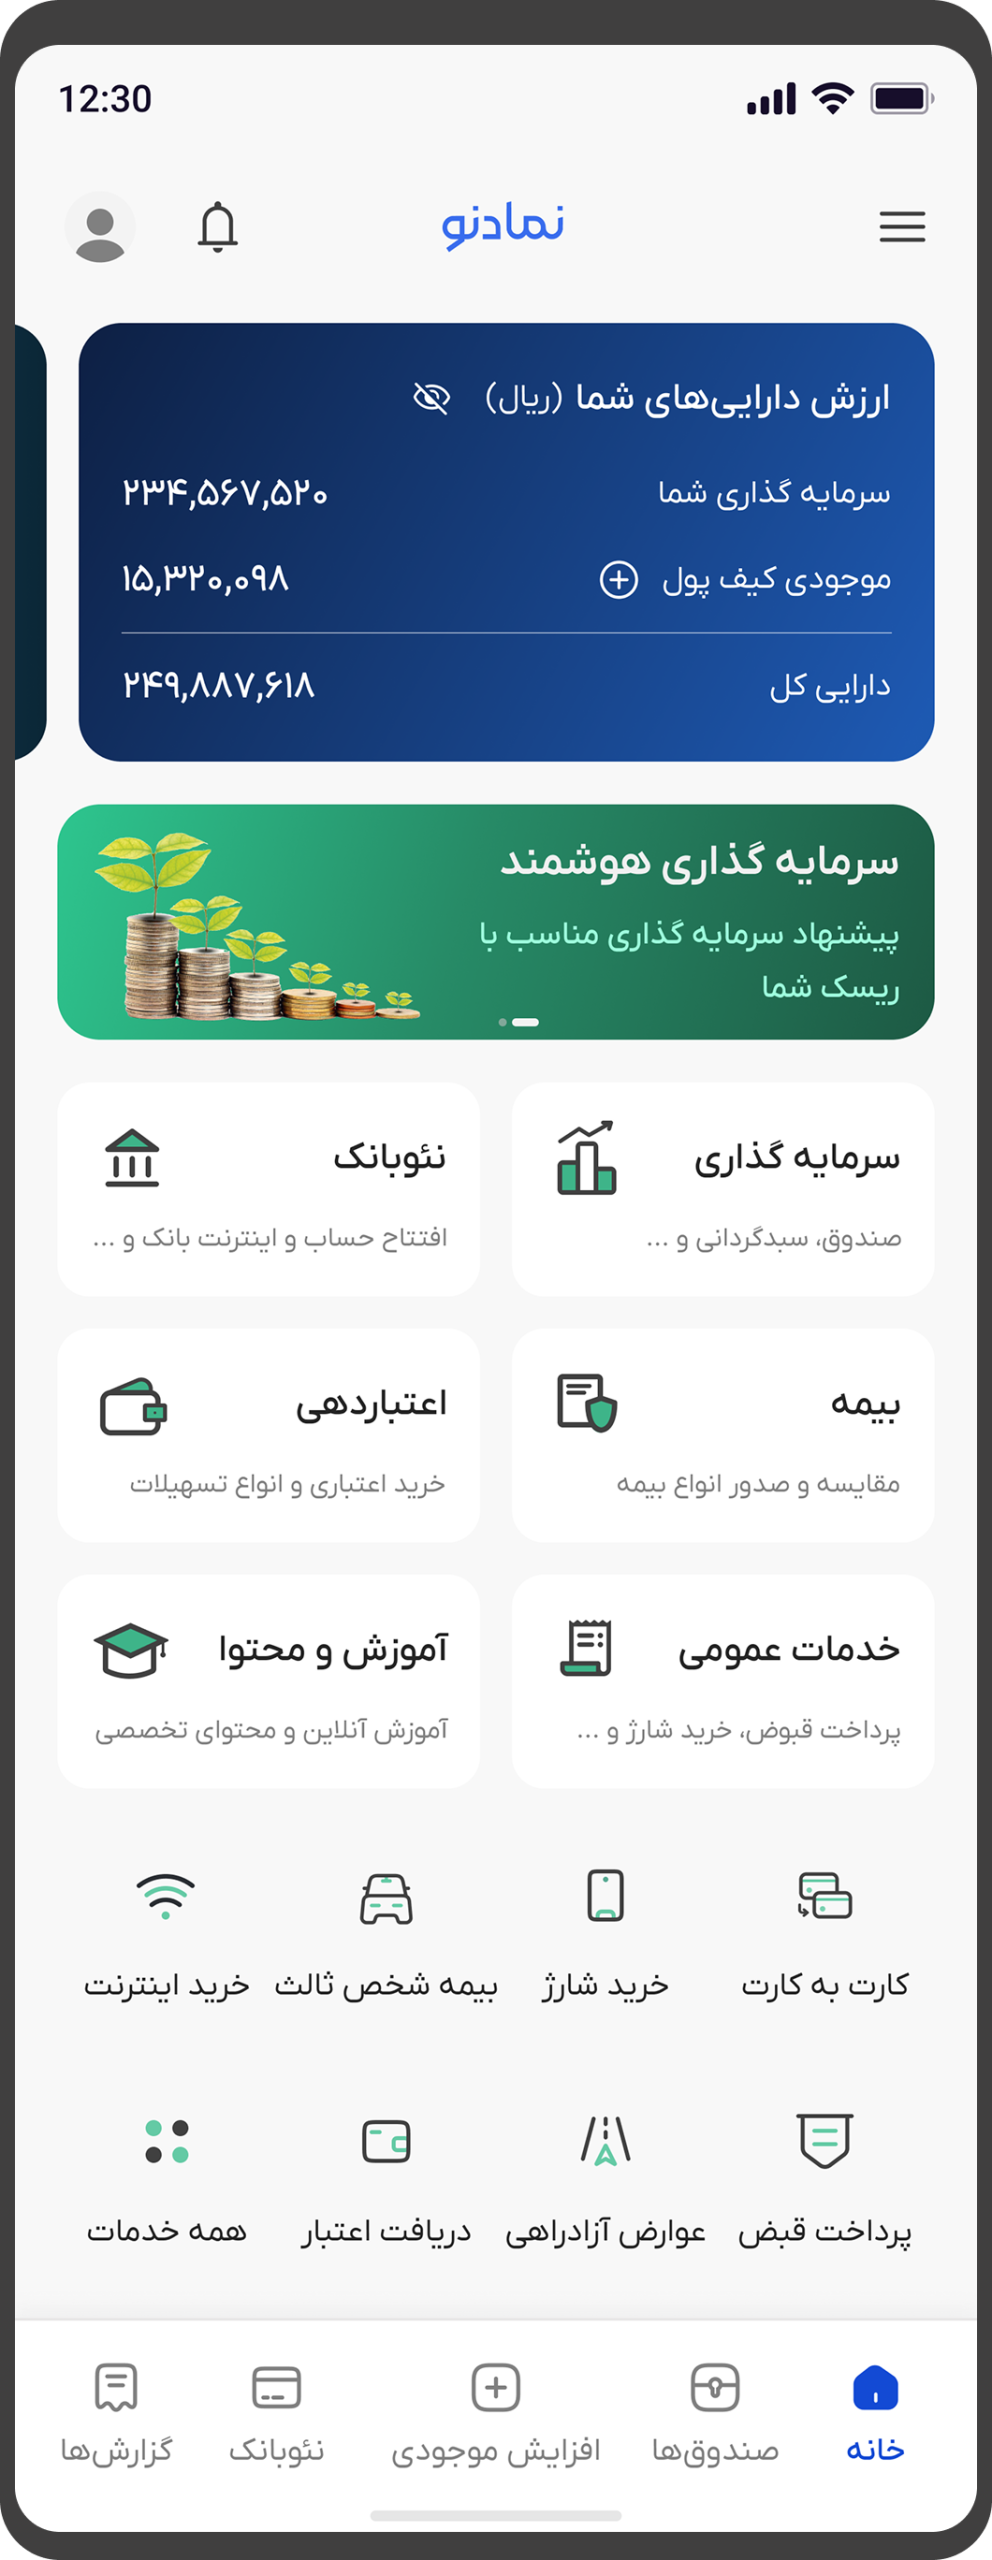
After the Discovery phase, it became clear that the main problem wasn’t just the multitude of services, but the lack of a single, understandable reference point for the user. Users needed to see their financial situation in one place before taking any action. So I defined the product design direction based on a Dashboard-centric model — where the user first sees an aggregated picture of their assets and financial situation and then enters the services. This decision allowed the experience to be shaped around the “user’s state” rather than a “list of services.”
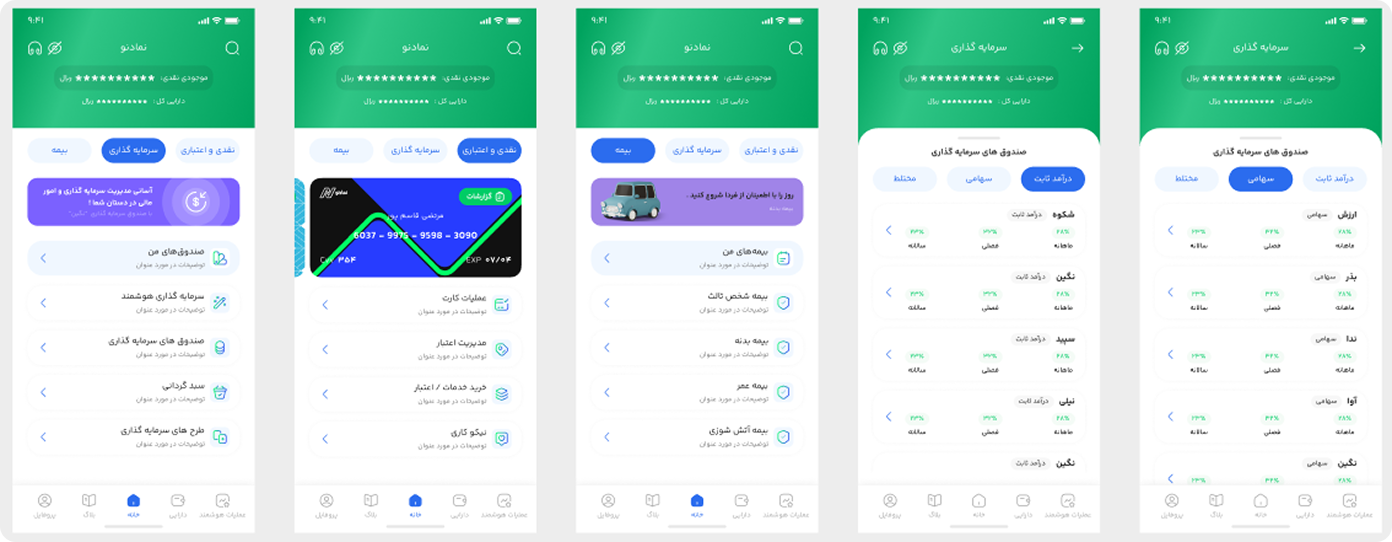
The structure I defined:
The home page structure was defined as follows:
A main card at the top of the dashboard to display:
Wallet balance
Investment balance
Total visible assets
Quick access to the 6 main app services in the next section
Display of microservices at the next level to avoid cognitive clutter
Limited and targeted use of banners for promotion and information
The purpose of this structure is to:
Reduce cognitive load
Create a focus
Prioritize critical financial information
Maintain quick access without clutter
The design principles that led to these decisions:
To avoid reproducing the previous fragmented experience, I based my design on a few principles:
State first, service next
Aggregate before detail
Prioritize with actionable data
Limit selection on the first page
Consistency of interaction patterns across services
Information Architecture and User Journey Design
Given the lack of a usable previous structure, I designed the information architecture from scratch. The goal was to bring together several disparate financial services into a coherent and predictable experience.
Instead of designing each service individually, I first defined a common structural framework.
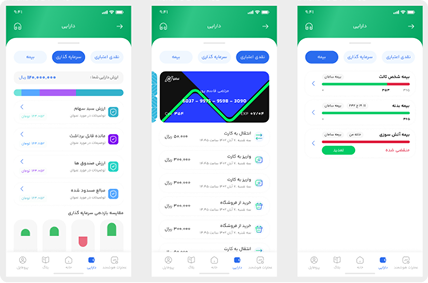
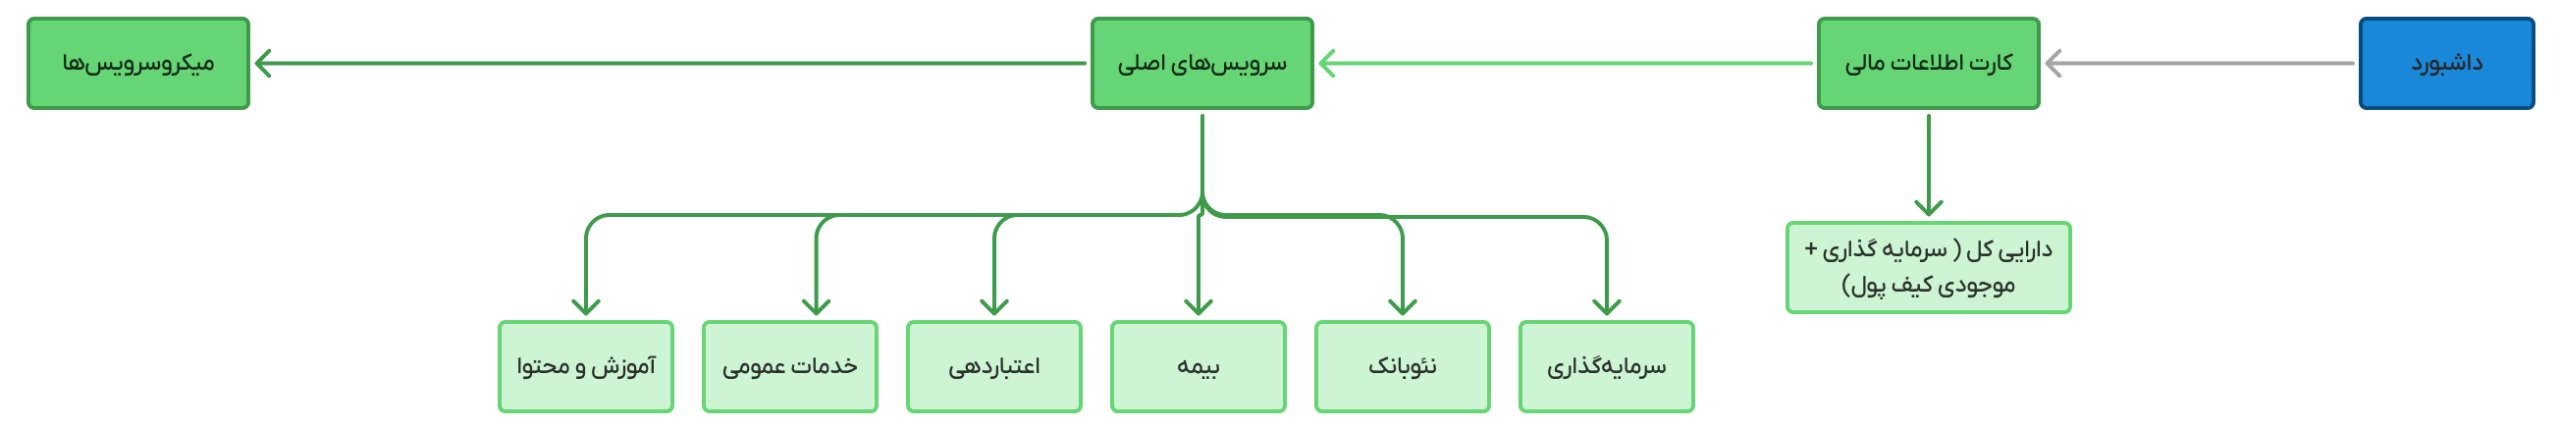
I defined the product architecture in three layers:
1. Overview
Consolidated view of the user's financial situation: entry point and decision-making reference
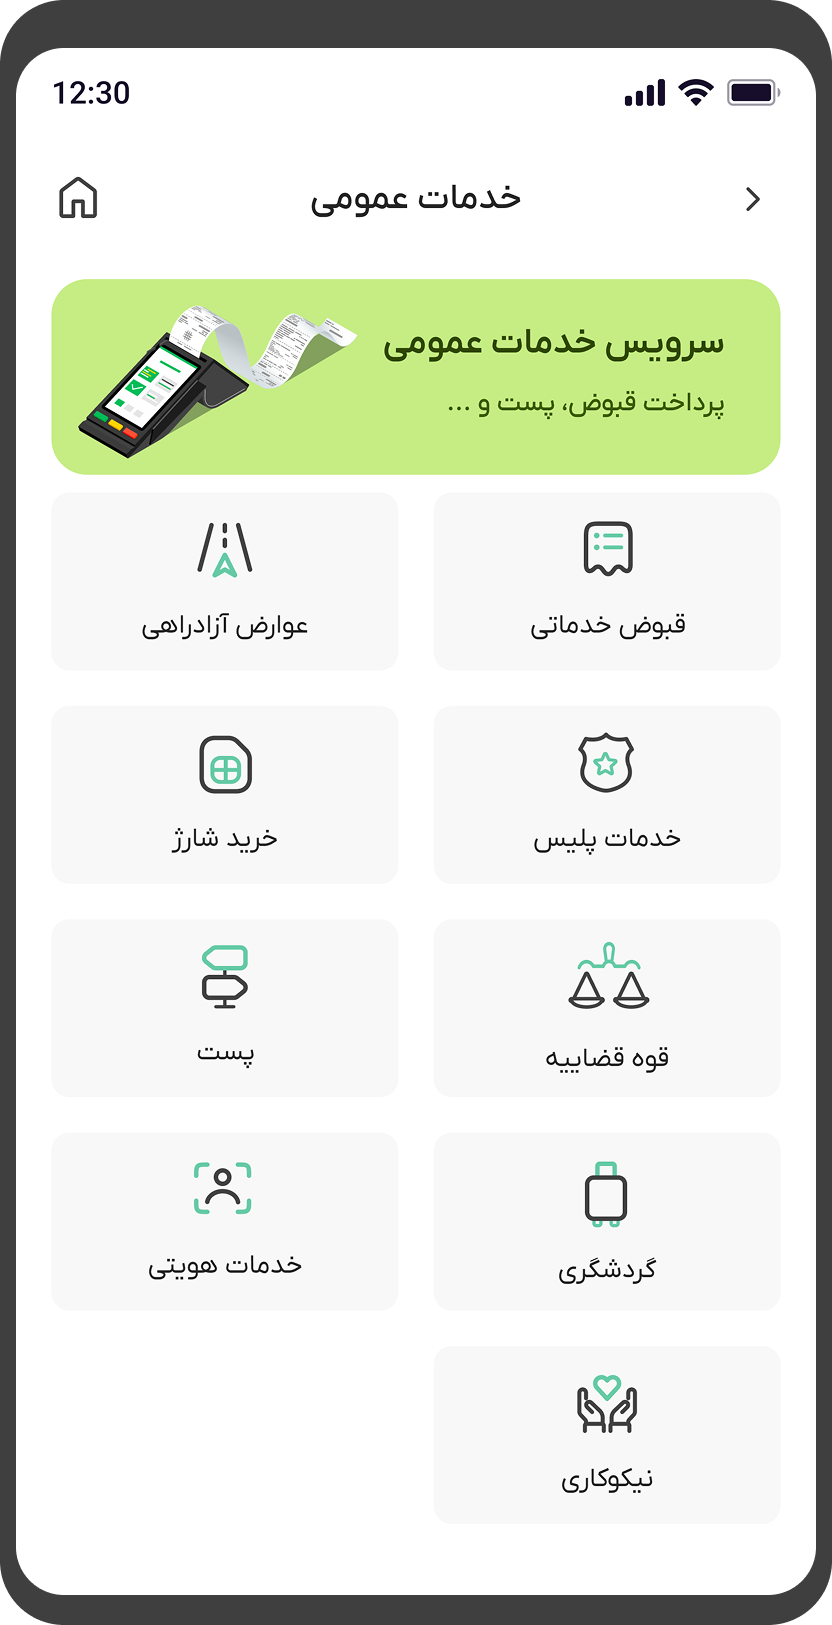
2. Primary Services
6 main services with the highest priority and use: direct and fast access
3. Secondary and Micro Services
Infrequent or complementary services: access without creating cognitive clutter
This layering helped prevent service congestion on the home page, maintain scalability for future services, and create a clear mental structure for the user.
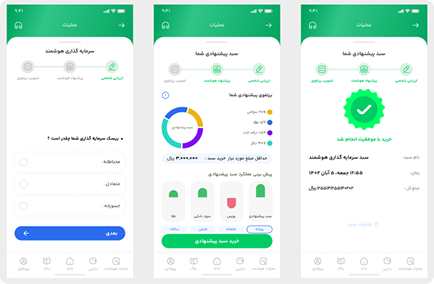
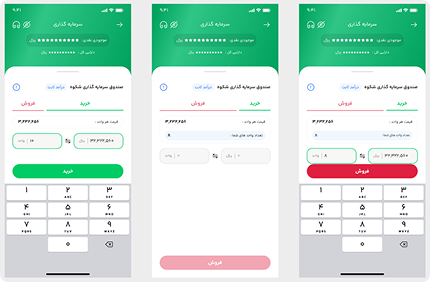
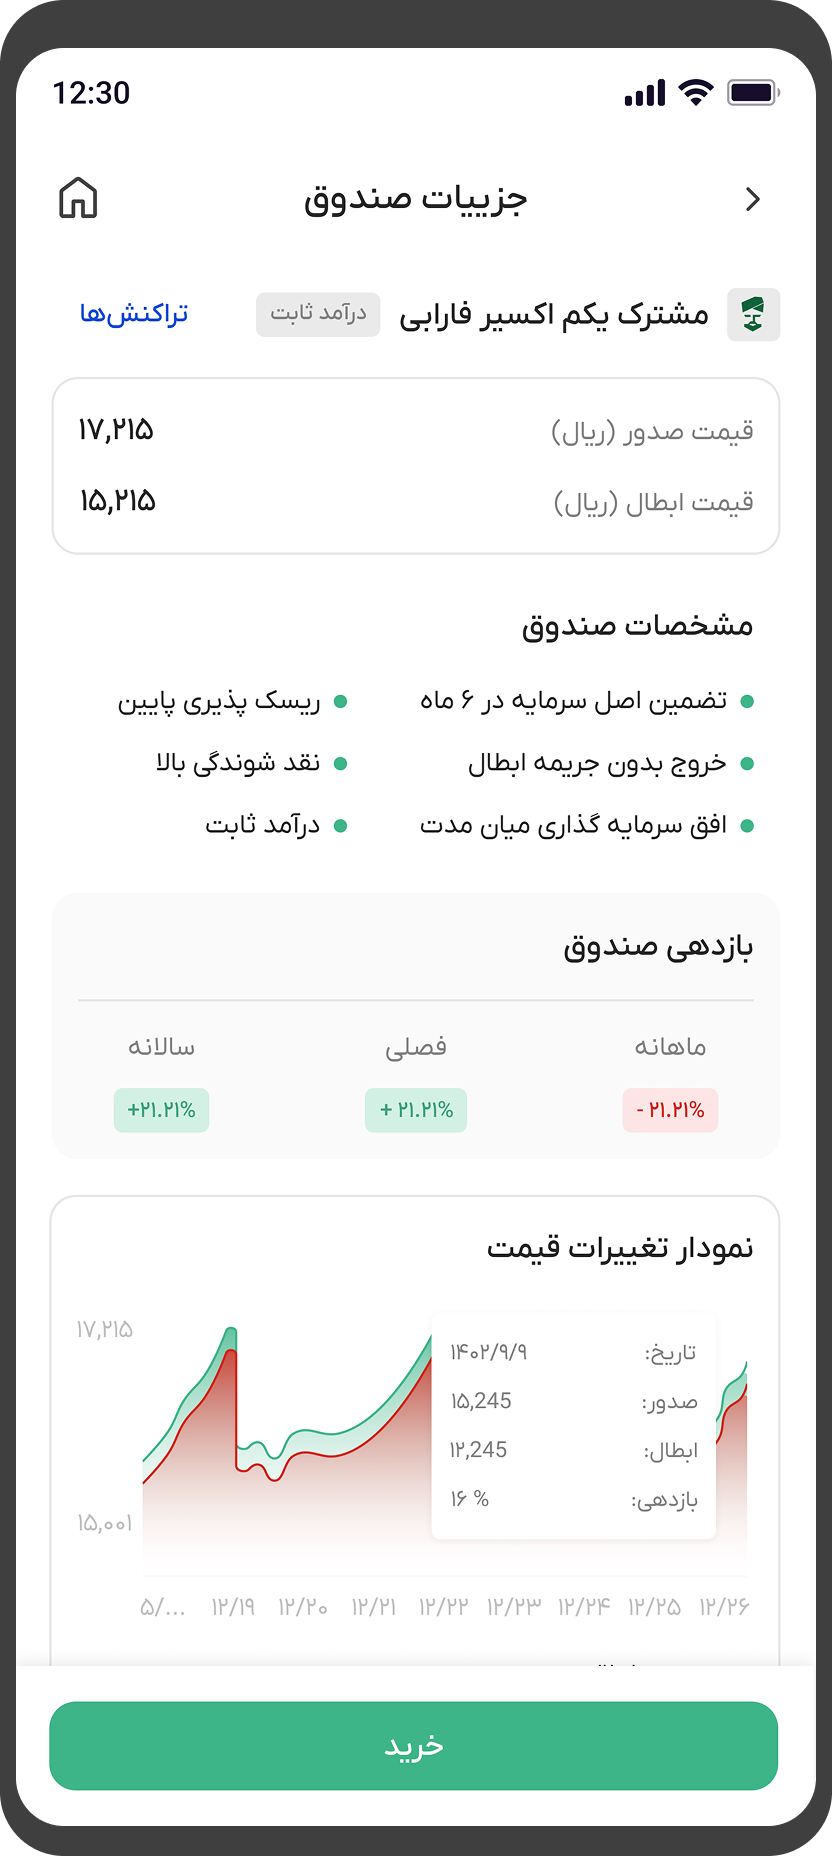
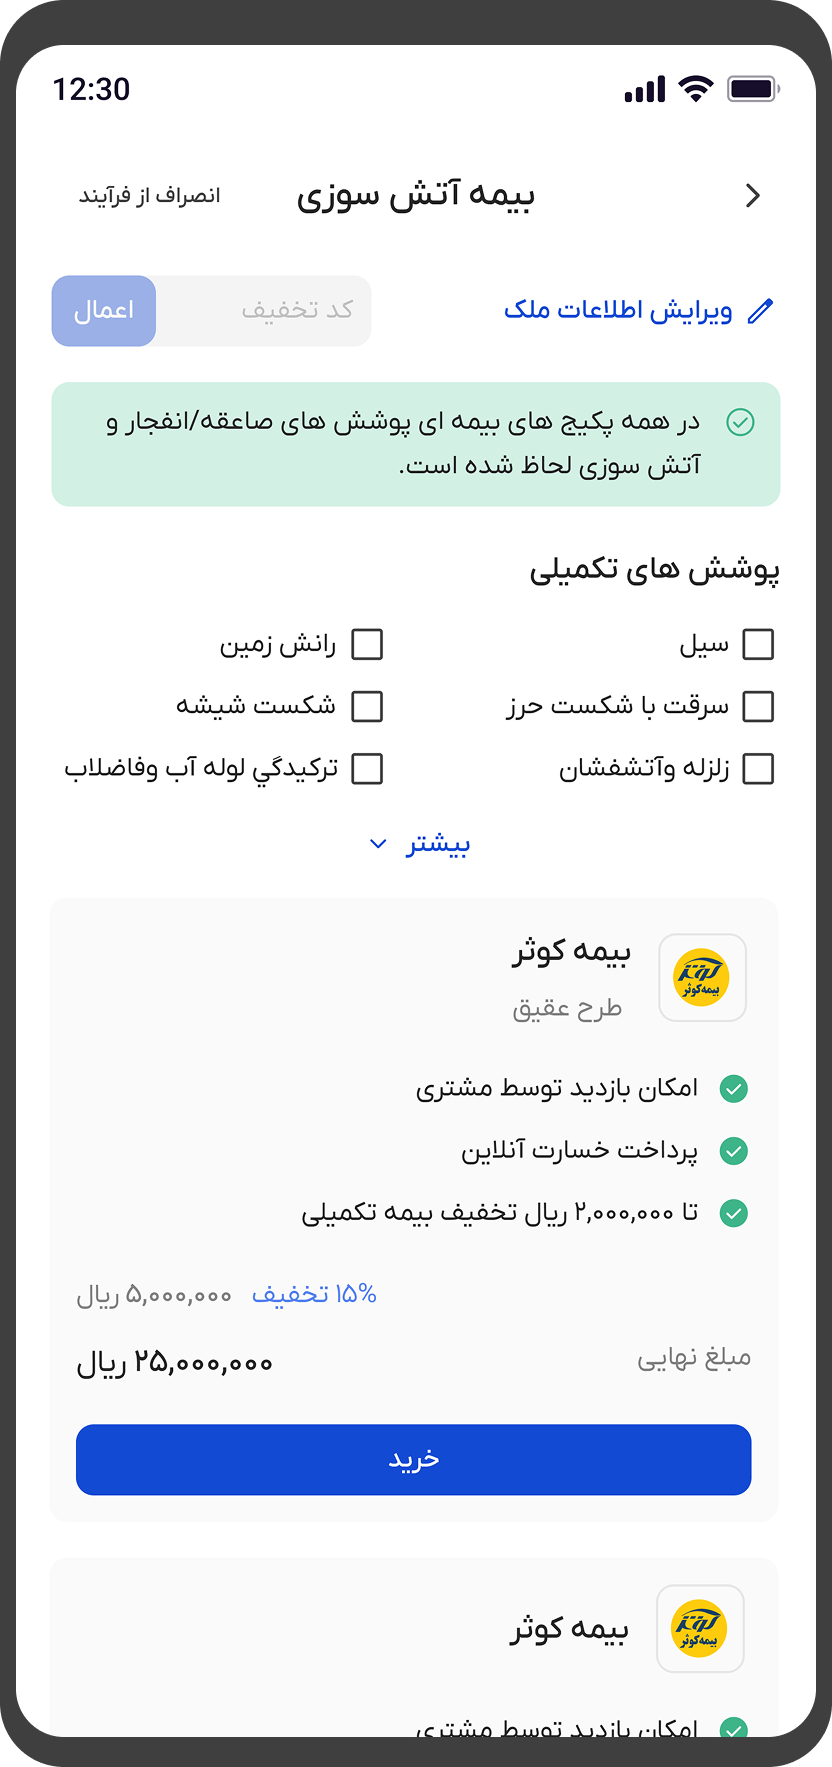
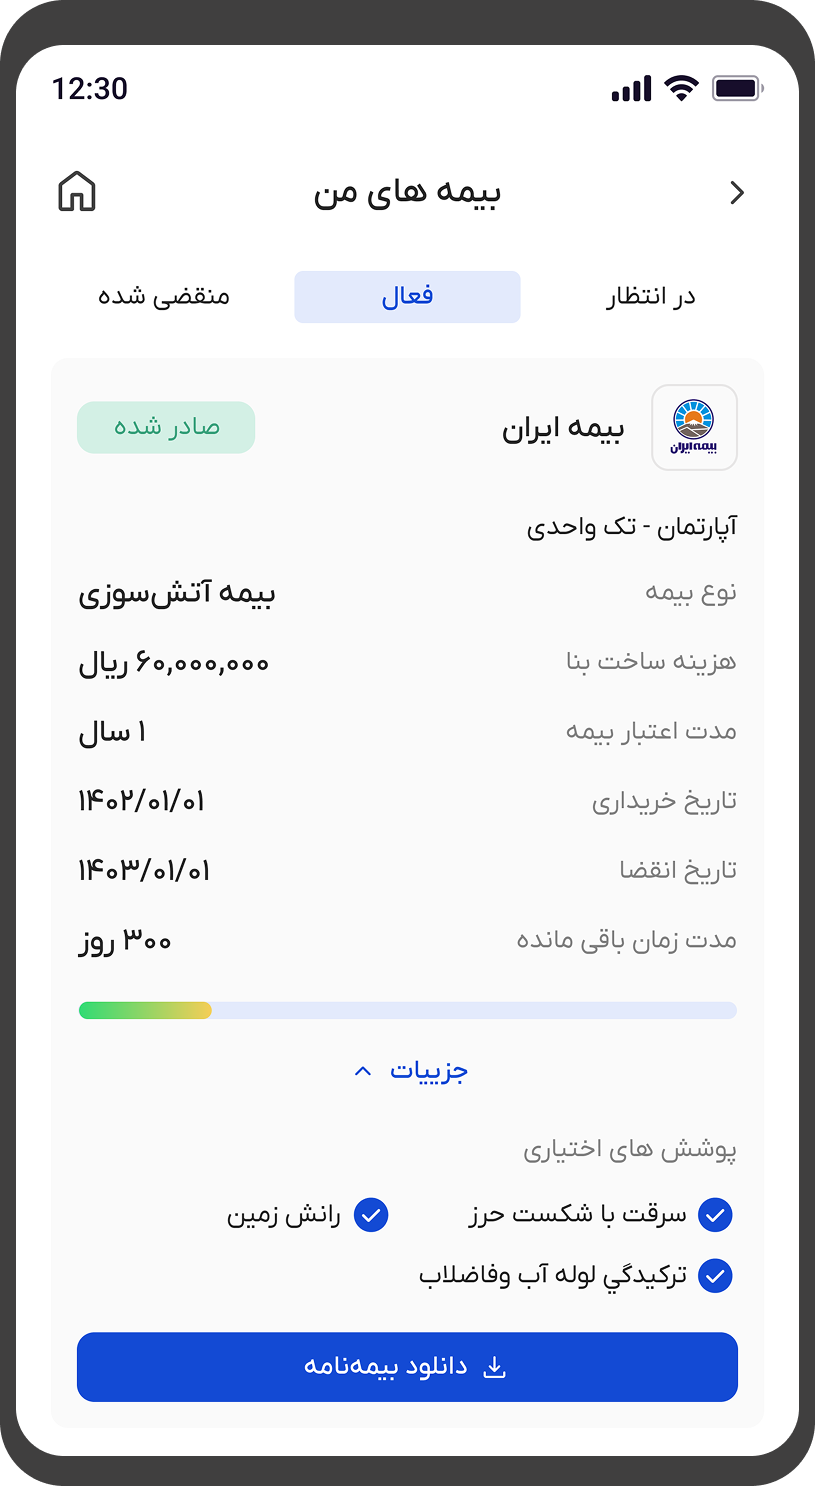
Designing a consistent user experience for services
Since all the services were under the same development team, it was possible to define a common flow pattern. So, I defined a consistent pattern for the services:
Login
Input/Selection
Review
Confirm
Perform Service
This pattern allowed:
Users to use other services without friction after learning one service
Reduced the complexity of financial services
Shortened development time (due to the use of an iterative pattern)
Trade Offs
I rejected displaying all services on the home page at once: due to increased cognitive load
I limited the visual variety for each service: to maintain a cohesive experience
I removed excessive information from the dashboard: to prevent it from becoming a complicated reporting page
Design Decisions and Visual Strategy
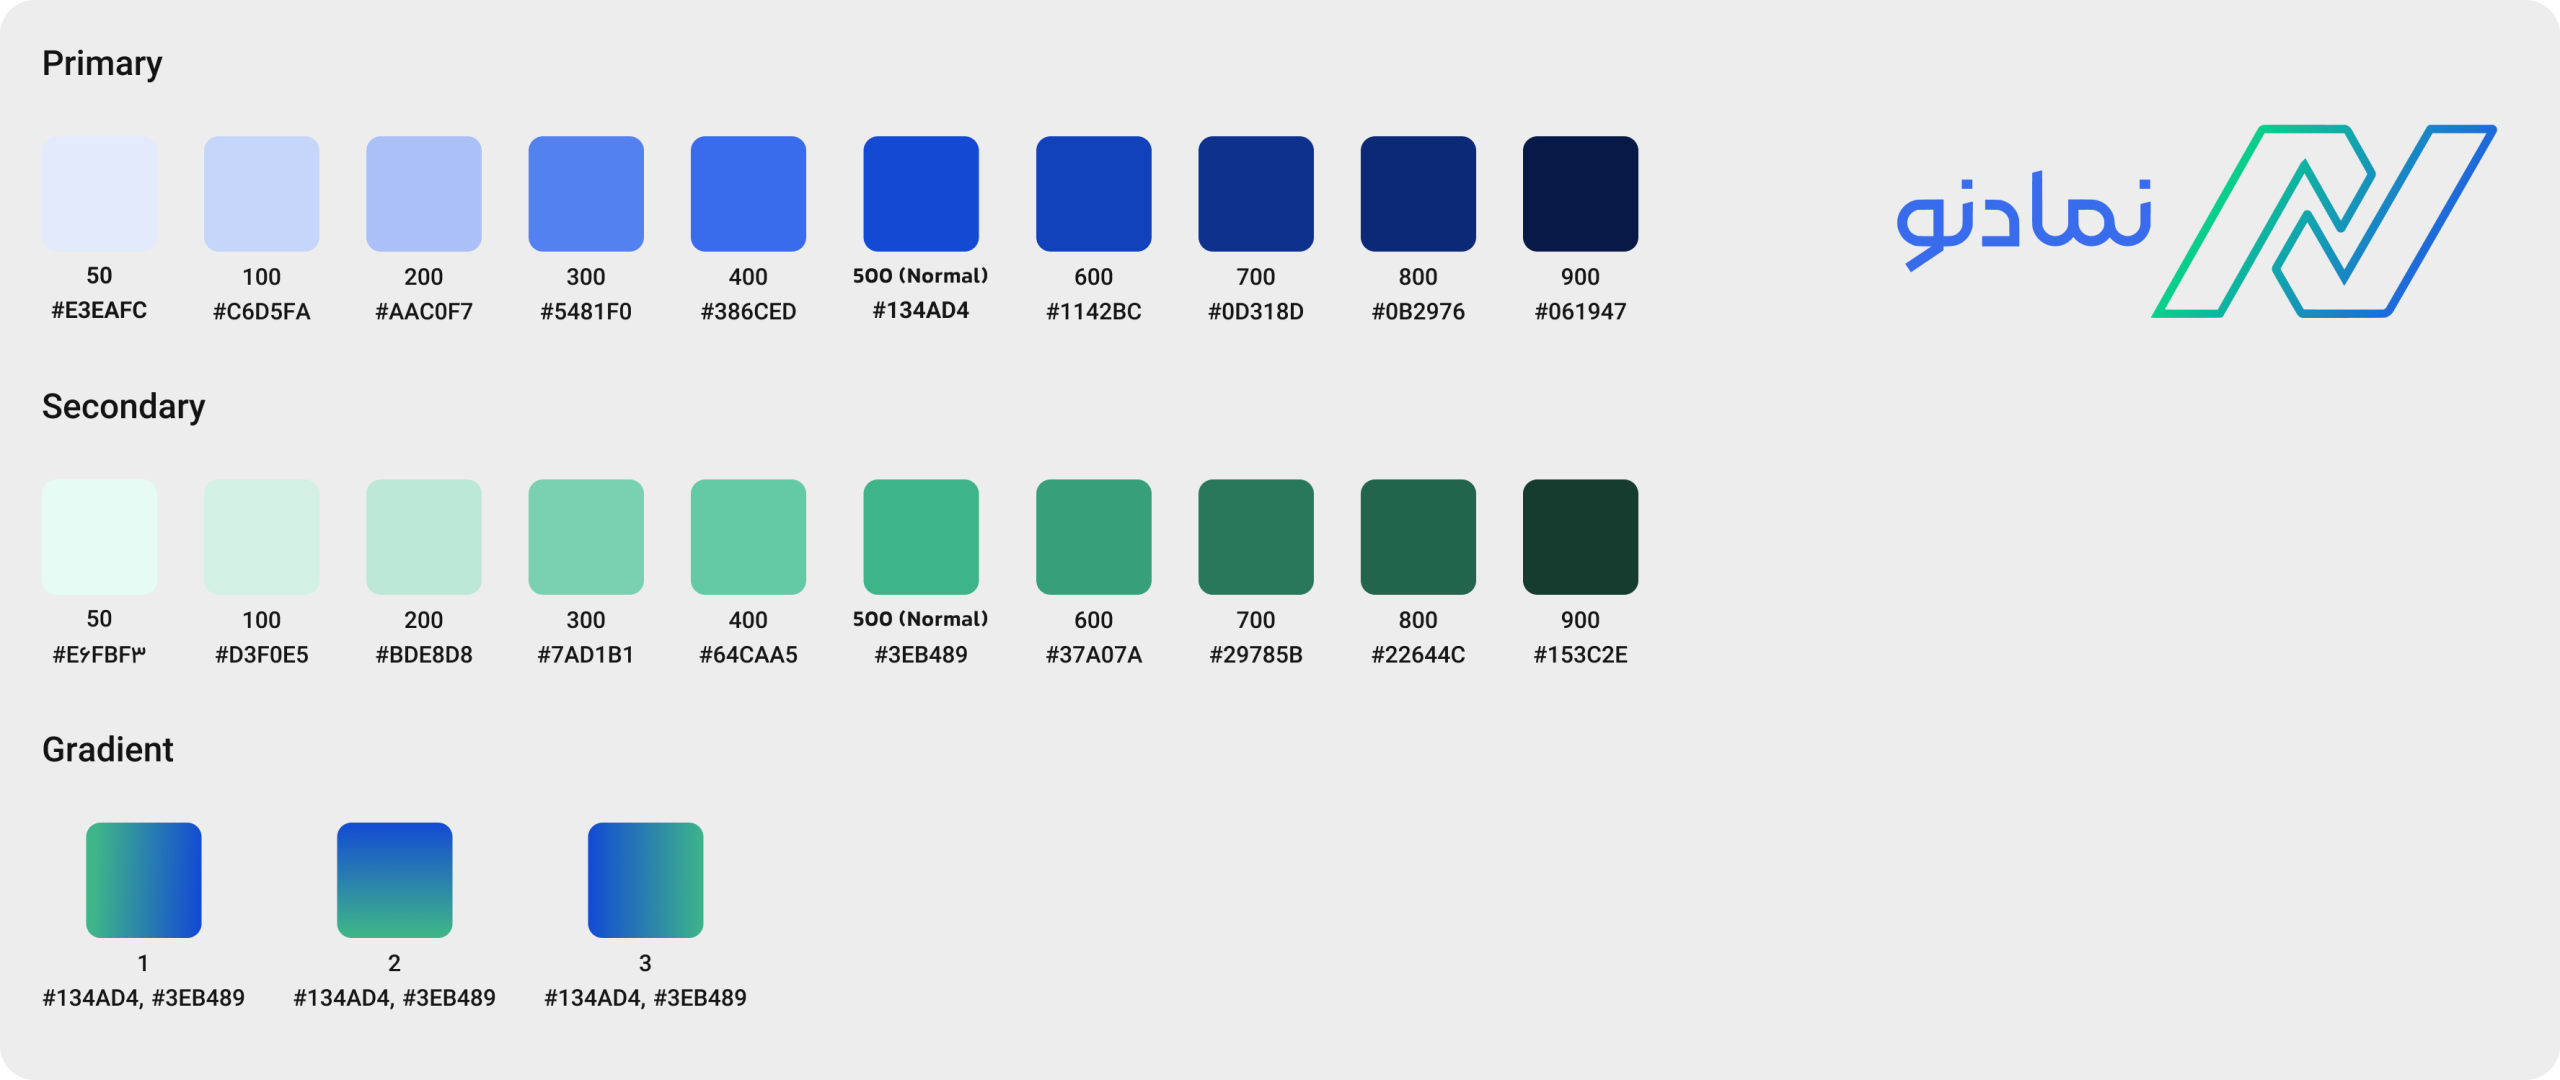
Building trust from the logo
I started with the logo gradient and turned it into a system:
Defining the Primary Color (the stable version that can be used in the UI)
Defining the Secondary Palette
Defining the Neutral Scale for levels, cards and backgrounds
Defining Semantic Colors for Success / Warning / Error
The goal was to:
convey a sense of security (green)
convey a sense of technology and modernity (blue)
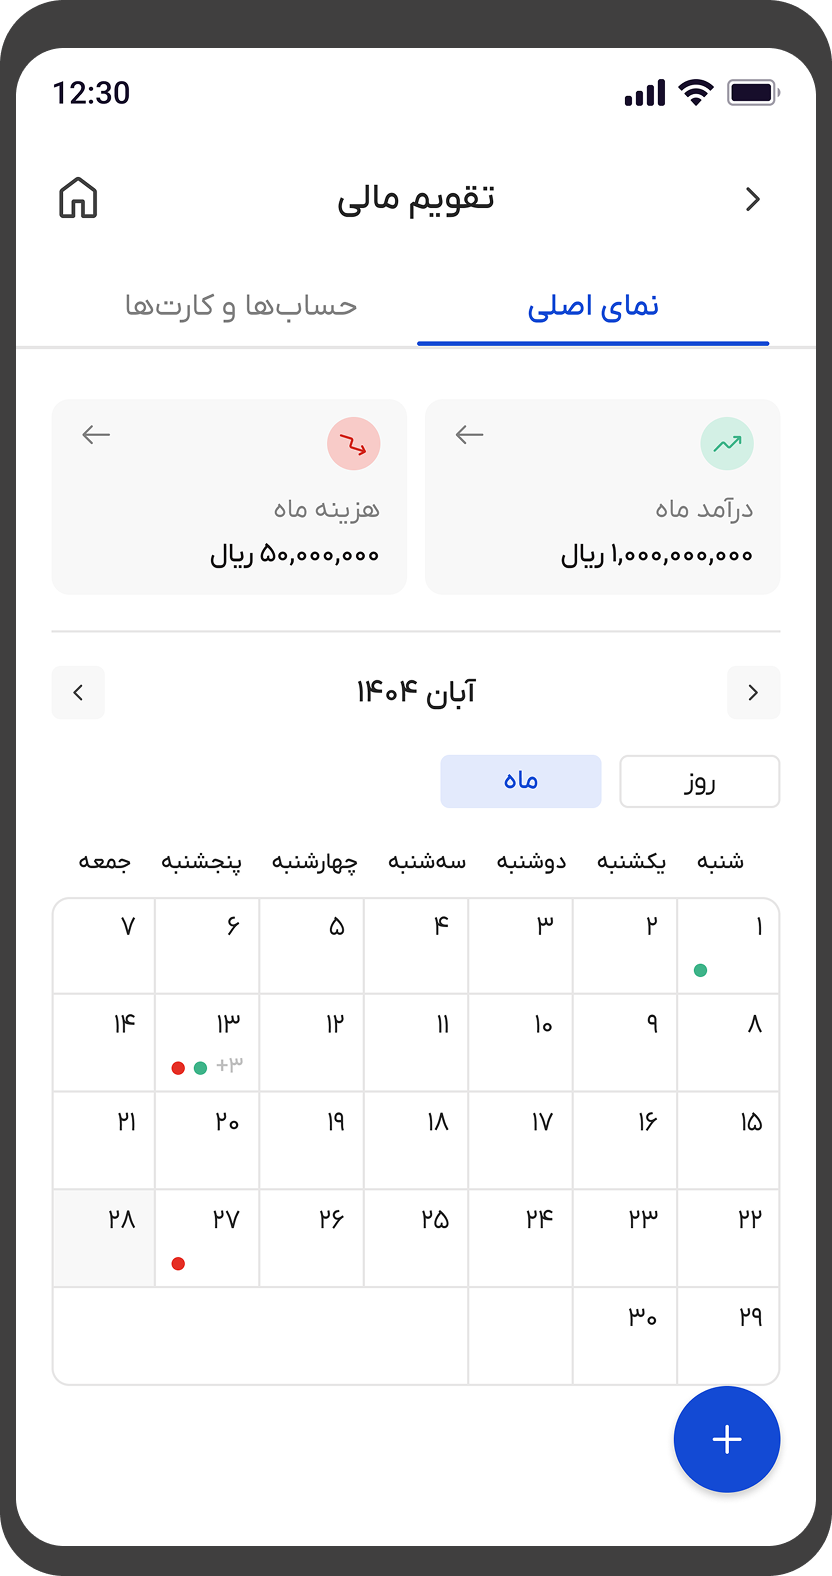
Elevating Main Dashboard Card
On the dashboard, there is a summary card that displays the following:
Wallet Balance
Investment Balance
Grand Total
I decided to make this card visually dominant and separate from the rest of the elements because:
It was the focal point of the user’s financial decision
It had the highest informational value
It had to convey a sense of “financial control”
This wasn’t an aesthetic decision; it was a cognitive decision.
Structure of 6 main services
I ranked the top 6 services based on the following points:
Usage
Financial importance
Mental grouping
I used the symmetrical grid pattern to:
reduce cognitive load
make scanning faster
keep the experience predictable
I kept the microservices at a lower layer to:
Maintain product depth
But not make the home page an endless list
Challenges Deep Dive
From the very beginning of the project, two main tensions guided the design decisions. Every decision I made was a response to one of these two.
Challenge 1: Comprehensiveness vs. Simplicity
This product was a financial superapp. And superapps have a classic problem: the more services you have, the greater the risk of losing clarity.
If we showed all services on the front page:
The page would become cluttered
Decision-making would become more difficult
The sense of professionalism would be lost
But if too few services were displayed:
The product looked weak
Its true depth was not visible
My Solution
Instead of adding or removing services, I layered the structure:
Anchor: Financial integration card at the top
Core: 6 core services
Extended: Microservices
The Status card served as a cognitive stabilization point. The user first saw their status, then decided what to do. This transformed the experience from a “list of services” to an “informed financial decision.”
Challenge 2: Consistency across different financial behaviors
The services varied greatly in nature, for example:
Money Transfer: Fast, Operational
Investing: Analytical, Riskier
Wallets: Status-Based
If each had its own unique experience, the user would have to learn a new pattern each time. In a financial product, this means friction.
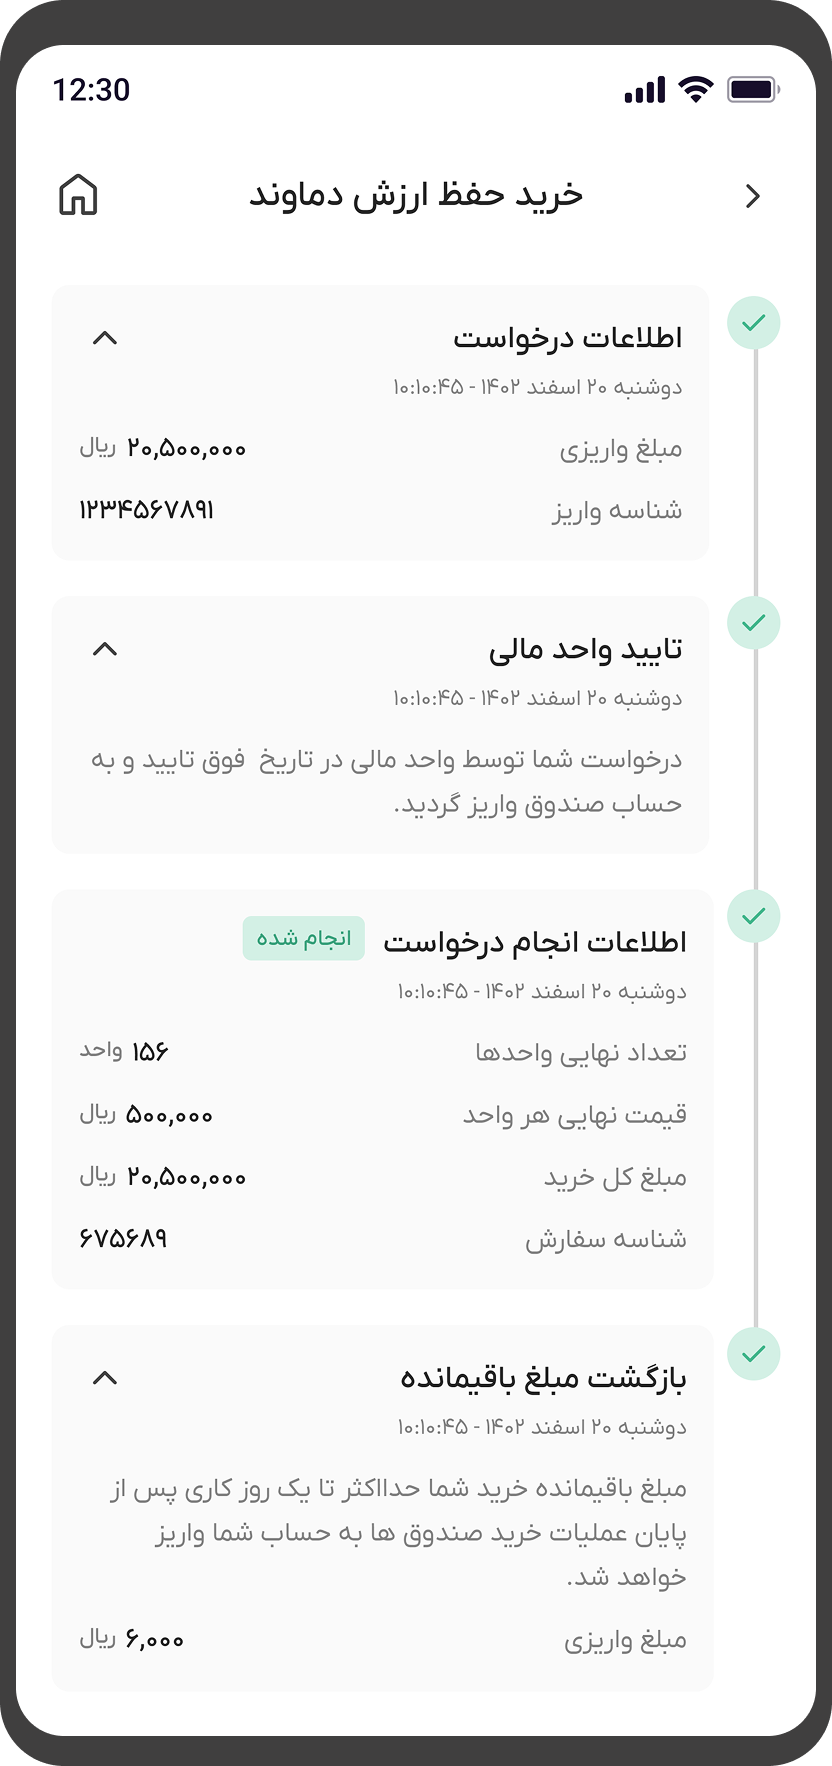
My Solution
I defined a common flow pattern and this pattern was applied to all services:
Entry → Input → Review → Confirmation → Success
Product behavior became predictable
Transfer learning was formed
Mental complexity was reduced
After using one service, the user used the others without stress.
Results and Impacts
The goal of this project wasn’t just to redesign the UI. The goal was to build clarity in a multi-service financial environment.
A clearer mental model
Before this structure, services were seen in a fragmented manner. After layering:
Users first saw their financial status
Then chose an action
This reordering transformed the experience from “feature browsing” to “financial decision-making.”
Scalable Design Foundation
The visual system that was defined:
Enabled the addition of new services
Made development faster and more consistent
Moved the product out of the visual MVP state and created a scalable structure.
Stronger trust building
Unified visual identity and predictable behavior:
Made the product look more professional
Reinforced the sense of security
Bridged it from low-end financial apps
In fintech, Perception is a KPI in itself.
Reducing cognitive friction
The shared flow pattern resulted in:
Users not having to relearn
Reduced input errors
Increased sense of control
In financial products, reduced cognitive friction = increased trust.
Reflection
Designing without data taught me to focus on structure.
When I came on board, we had no behavioral data, no documented research, not even a successful previous version. In such a situation, the temptation is to quickly build a UI and move on.
But this project taught me:
When you don’t have data, you have to build a structure.
Instead of relying on numbers, I focused on enduring principles:
Clarity of information hierarchy
Predictable behavioral patterns
Reducing cognitive load
Building trust through visual consistency
If I had more time and resources:
I conducted structured usability tests
Analyzed user behavior in the dashboard
And re-prioritized services based on real data
But even without these, building a cohesive foundation allowed the product to transform from a fragmented state into a scalable system.
The value of this project to me:
This project for me wasn’t just about designing a super app. It was an exercise in:
Designing in Ambiguity
Building a System from Scratch
Creating Order in Complexity
Next, I would validate prioritization through behavioral data and refine service prominence based on usage frequency.


